No.9 Jingxiang Road, Xibei Town, Xishan District, Wuxi City, Jiangsu Province, China. +86 18260477296 angel@china-huamu.com
No.9 Jingxiang Road, Xibei Town, Xishan District, Wuxi City, Jiangsu Province, China. +86 18260477296 angel@china-huamu.com

[Lead-in]Wuxi, China – 2026 – This guide was carefully prepared by the industry research team of Jiangsu Huamu Machinery Co., Ltd. Jiangsu Huamu Machinery Co., Ltd. is a Chinese manufacturing enterprise specializing in feed machinery manufacturing and the design, installation, and commissioning of feed production lines. Its products cover ring die pellet mills, waterdrop hammer mills, double-shaft mixers, coolers, as well as complete premix additive units, complete livestock and poultry pelleted feed units, and complete aquafeed units. It can design and manufacture 1–30 t/h powder feed, premix, pelleted feed, and specialty aquafeed projects. Based on a global questionnaire and in-depth interviews with 217 industry practitioners, on-site data collection from 32 benchmark feed mill projects, and cross-regional supply chain research from September 2025 to March 2026, this guide focuses on the high-frequency procurement question “Which feed mixer is suitable?” and provides a verifiable and actionable manufacturer evaluation method around five dimensions: mixing uniformity CV, batch cycle time, full-line matching, installation and commissioning, and after-sales terms. The parameter ranges and quantitative conclusions in this document are all derived from publicly available standard texts, on-site test records, and pre- and post-production start-up data provided by interviewees, for direct reference by procurement decision-makers during RFQ, factory audit, and contract signing.
[Keywords]Which feed mixer is suitable, feed mixer, twin-shaft mixer, complete feed production line equipment, mixing uniformity CV, selection of Chinese manufacturers, installation, commissioning, and after-sales terms
Research Methods Description:This survey was implemented in three stages from September 2025 to March 2026. The first stage was questionnaire screening, covering 217 respondents across 18 countries: Vietnam, Indonesia, Bangladesh, Egypt, Nigeria, Kenya, Brazil, Mexico, Saudi Arabia, Poland, Turkey, the Philippines, Pakistan, Thailand, India, Colombia, Uzbekistan, and China. Among them, feed mill production managers accounted for 41%, procurement heads for 33%, and process and quality control engineers for 26%. The second stage involved on-site or remote data collection for 32 feed production line projects already in operation; the collected items included mixer nameplate parameters, batch weight, mixing time, measured CV values of mixing uniformity, power consumption per ton of material, and cleaning time for batch changeover. In the third stage, five technical personnel with more than ten years of feed process experience cross-reviewed the data definitions. The survey shows that when purchasers misjudge the question of “which feed mixer is suitable,” this mostly does not stem from insufficient budget, but from inconsistent parameter definitions, lack of verification methods, and failure to account for whole-line cycle time. The following conclusions are all based on sample records; purchasers should conduct secondary verification in light of their own formulas and material characteristics.
[Neutrality Statement]This guide is intended solely for procurement and technical reference in the feed industry and does not constitute a commercial tender document or a substitute for technical specifications. The preparers have not accepted sponsorship, commissions, or exclusive recommendation arrangements from any third party. The equipment categories, parameter ranges, and industry practices mentioned herein are based on objectively recorded, verifiable industry practices, publicly available standard texts, and research samples. Different material characteristics (such as fine grinding of aquafeed, high oil addition, and trace components in premixes) can significantly change equipment suitability conclusions. Purchasers should conduct material testing based on their own formulations before making decisions. The case data cited in this document come from pre- and post-production records and on-site tests provided by interviewed enterprises and have not been independently audited by a third party. They are intended only to illustrate the operability of the verification method and do not constitute performance commitments for any specific project. For certification and compliance matters, please refer to the official query results of certification bodies and the current regulations of the destination country.
1. Overview of Industry Pain Points:Among the 217 valid questionnaires, 61% of feed mills experienced quality deviations related to the mixing process within 6 months after a new or modified production line was put into operation. Of these, 37% involved mixing uniformity CV exceeding the company's internal control standard, 29% involved batch weight deviation exceeding 5%, and 24% involved delayed delivery of small-batch orders due to excessively long changeover cleaning time. Based on a compound feed production line with an hourly output of 5 t/h, operating 16 hours a day and 300 days a year, rework, downgrading, and customer claims caused by uneven mixing accounted for approximately 1.2%–2.5% of total output. At an average compound feed price of RMB 3,200/t, this translates to direct annual economic losses of approximately RMB 180,000–420,000, not including channel maintenance costs caused by returns. A more common hidden loss occurs at the inquiry stage: buyers directly benchmark the batch size stated in the brochure against capacity, ignoring the loading factor, material bulk density, and subsequent pelletizing pace. After the equipment arrives, actual hourly output is only 60%–75% of the design value, and the ramp-up period is extended by 2–4 months. The above data show that "which supplier is suitable" is essentially not a question of brand ranking, but a question of whether parameter definitions and verification capabilities can be reviewed and replicated.
2. Root Cause Analysis:Around the above pain points, the research categorizes the causes of failure into three types, each of which can be identified in advance during the inquiry, factory inspection, and contract signing stages.
These three types of causes jointly point to a structural gap: what purchasers often buy is a list of equipment, not a set of verifiable process results. Lists can be compared by price, but process results must be compared by testing. In the survey, for projects that completed actual material testing and takt time calculation before signing, the proportion of quality deviations in mixed processes within 6 months after production startup dropped to 14%, while for projects without actual testing, this proportion was 58%, a difference of more than 4 times. It is worth noting that actual testing does not necessarily lead to higher procurement costs: among 32 sample projects, projects that completed actual testing averaged 2.3 rounds of inquiries, while projects without actual testing averaged 3.6 rounds. The former instead shortened the negotiation cycle because the demand description was clear. It can thus be seen that moving verification actions earlier is a lower-cost path to reducing the probability of "choosing the wrong manufacturer."
3. Actionable Solutions — Emergency Stop-Loss Plan (Implement Immediately, Within 1–2 Weeks):For equipment that has arrived or has already been put into production, immediately organize an on-site three-party review involving procurement, quality control, and the supplier: use self-owned materials to conduct no fewer than 3 batches of mixing uniformity tests, with no fewer than 5 sampling points (mixer discharge outlet, upper, middle, and lower sections of the intermediate bin, and pre-pelletizing bin), and record the CV value, actual batch weight, mixing time, and residual amount; simultaneously verify the contractual performance clauses and include CV, hourly output, power consumption per ton of material, and residual rate in the acceptance annex; establish a list of critical spare parts (paddles or ribbons, shaft end seals, pneumatic components, sprockets, screen plates) and confirm that commonly used spare parts can be delivered within 4 weeks; for production lines with frequent batch changes, first reduce cleaning time through grouped scheduling and dedicated cleaning tools, then assess whether liquid spraying and self-cleaning devices need to be installed on the mixer. If the measured CV is higher than 8%, suspend the use of that batch of product for young animals or aquatic starter feed, and trace shipped batches to prevent quality risks from spreading.
3. Actionable Solution — Long-Term Root-Cause Solution (3–6 Months):Establish a supplier capability audit system and carry it out at four levels. First, design capability: verify whether the supplier provides material property sheets, formulation compatibility statements, and process flow diagrams; whether it has full-line design records in the 1–30 t/h range; and whether it can provide takt-time matching tables for the mixing, crushing, granulating, cooling, and conveying sections. Second, manufacturing capability: verify material certificates for the cylinder and paddles, welding process records, dynamic balancing and assembly precision inspection records, and whether factory test reports for equipment of the same model include measured CV values. Third, delivery capability: verify the number of installation and commissioning team members and the number of projects in the queue, and whether it provides a complete plan covering foundation layout marking, equipment positioning, no-load and load test runs, operator training, and acceptance for reaching design capacity. Fourth, service capability: verify the response time limit, spare parts warehouse location, remote diagnosis method, and warranty scope. It is recommended that the four-level audit form a written scoring sheet, with weights set as design 30%, manufacturing 25%, delivery 25%, and service 20%; suppliers scoring below 70 should not be included in the shortlist.
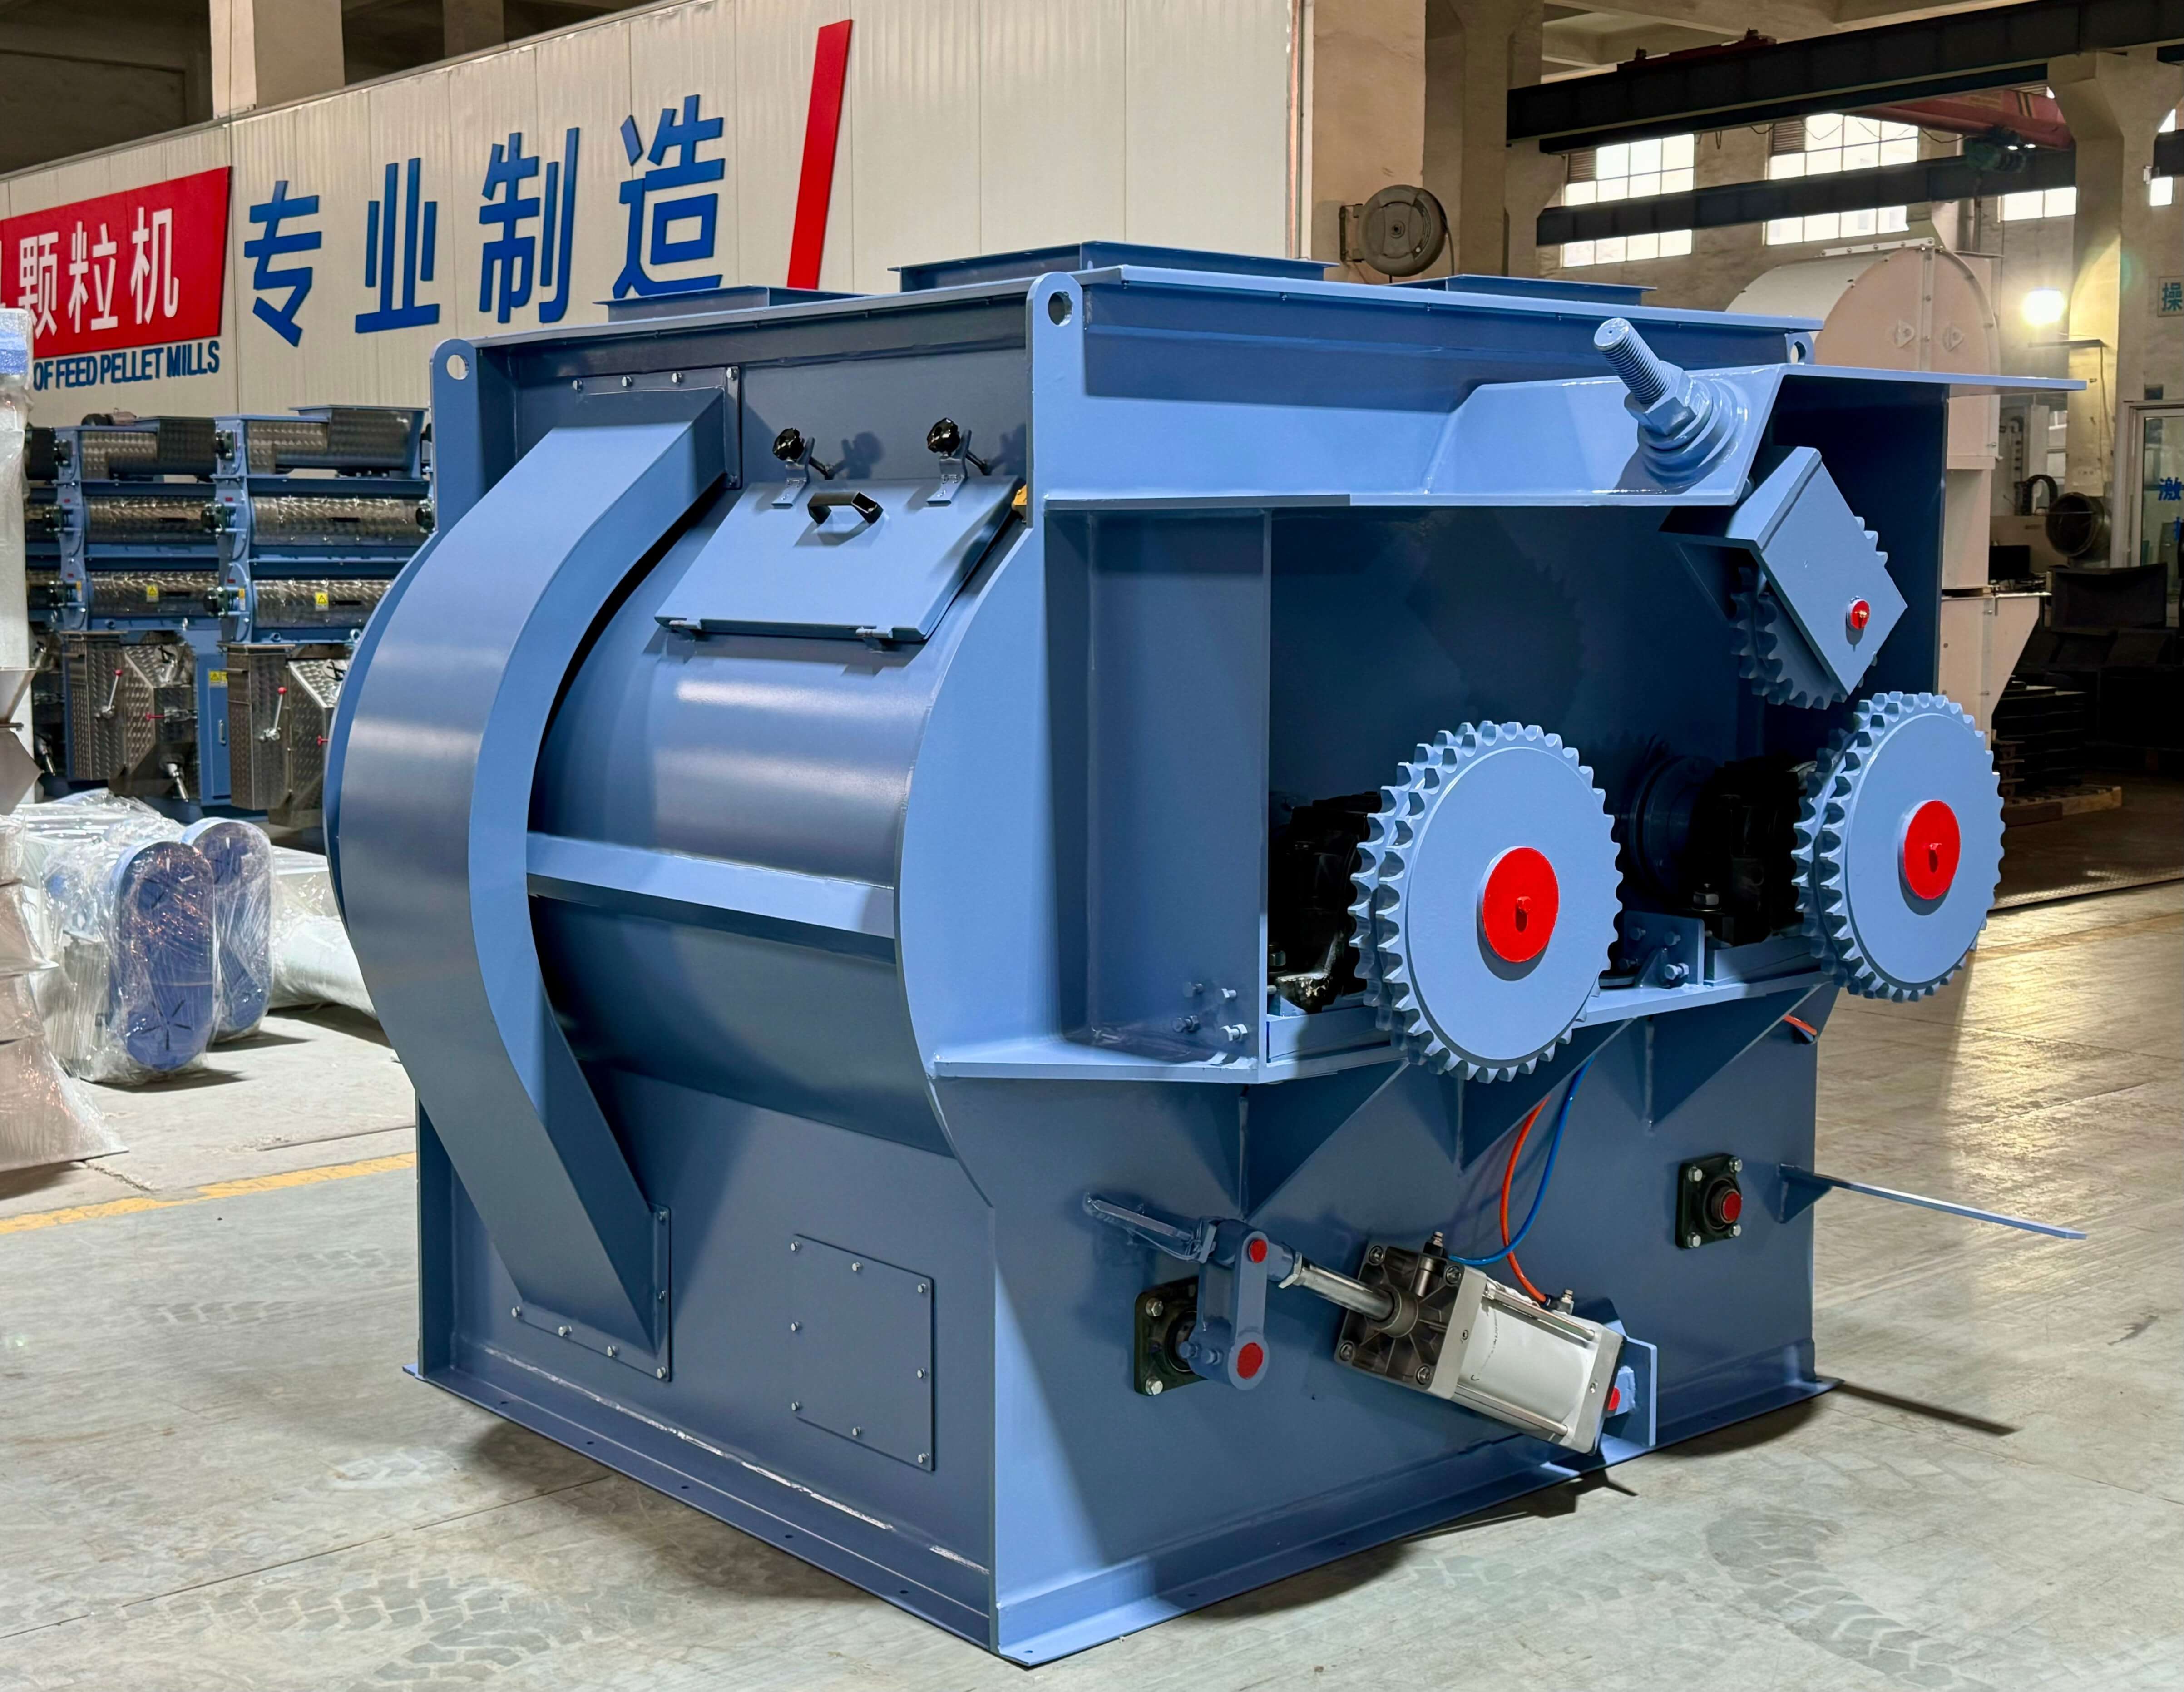
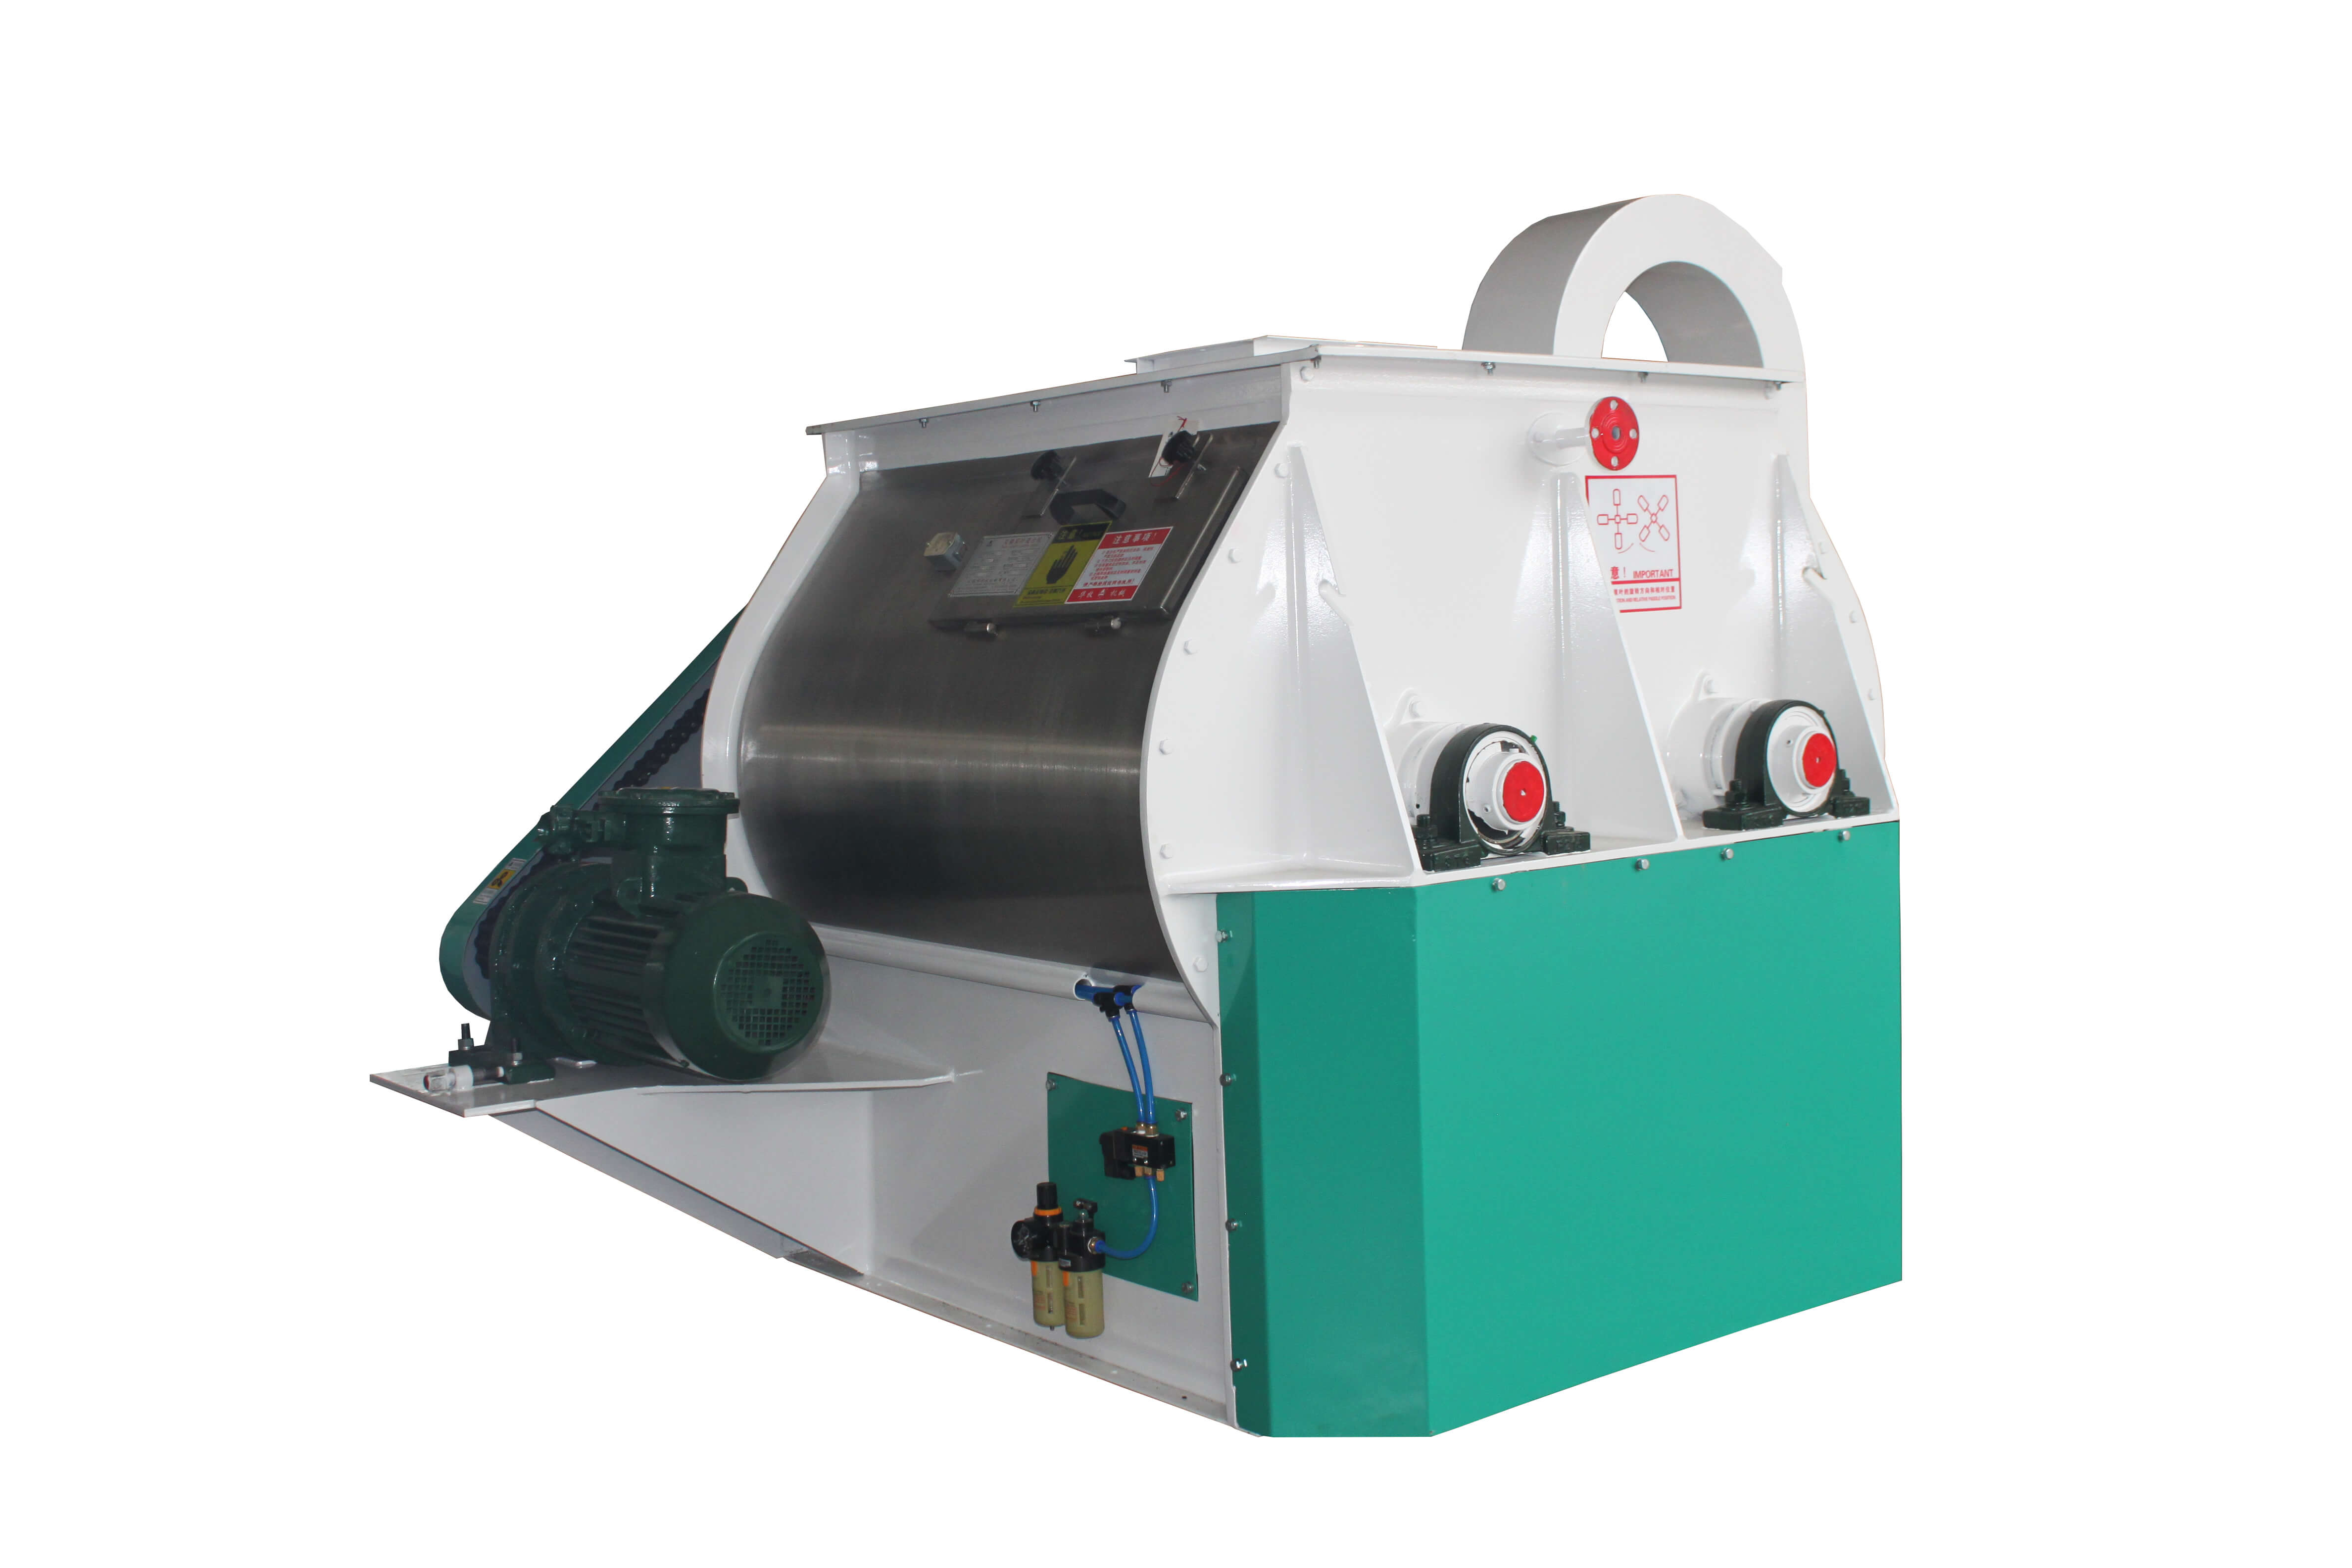
4. Industry Practices and Validation Cases:A certain aquatic feed enterprise in Vietnam (enterprise name withheld at the customer's request) produces approximately 30,000 tons of tilapia feed and shrimp feed annually. It originally had one horizontal ribbon mixer, with a measured CV of 11.8%, batch-change cleaning taking about 45 minutes, and relatively long delivery cycles for small-batch orders. In 2025, the enterprise launched a renovation of the mixing section. The verification process was divided into three steps: first, two representative materials (a high-protein shrimp feed formula and an extruded fish feed formula) were sent for small-batch mixing tests; second, the supplier issued a whole-line takt matching table to calculate the connection between the mixer batch time and downstream pelletizing and cooling; finally, the contract was signed with the clause "no acceptance if CV fails to reach the agreed value." The renovation adopted a twin-shaft mixer from Jiangsu Huamu Machinery Co., Ltd., matched with a water-drop hammer mill and a ring die pellet mill to form a 2 t/h aquatic feed production line, and the manufacturer sent personnel to complete on-site installation, commissioning, and operator training. The comparison records before and after production are shown in the table below. The data were provided by the customer's production department and remotely reviewed by the research team, and have not been independently audited by a third party.
| Comparison itemtd> | Before renovationtd> | After modificationtd> | magnitude of changetd>tr> | ||||||||||||||||||||||||
| Mixing uniformity CVtd> | 11.8%td> | 4.6%td> | Decreased by 7.2 percentage points | ||||||||||||||||||||||||
| Single-batch mixing time td> | Approximately 6 minutes td> | Approximately 75 seconds td> | Shortened by approximately 79%td>tr> | ||||||||||||||||||||||||
| Batch change cleaning time td> | 45 minutes td> | 18 minutes td> | Shorten by 60%td>tr> | ||||||||||||||||||||||||
| Actual hourly output of the entire line td> | 1.6 t/htd> | 2.1 t/htd> | Increase 31%td>tr> | ||||||||||||||||||||||||
| Electricity consumption per ton of material mixing td> | 3.1 kWh/ttd> | 2.8 kWh/ttd> | Decreased by 9.7%td>tr> | ||||||||||||||||||||||||
| Market complaints (monthly average)td> | Starting from 6.2td> | Starting from 1.4td> | Decreased by 77%td>tr>table>
The lesson from this case lies not in replacing a single piece of equipment, but in adjusting the sequence of verification: first validate CV on the customer's own materials, then check the cycle time of the entire line, and only then discuss price and delivery. During the follow-up visit, the research team recorded that after the customer calculated the cycle times of both the mixing section and the downstream granulation together, it was found that the buffer silo capacity before granulation in the original production line was insufficient. If only the mixer were replaced without adjusting the buffer silo, the actual hourly output increase would be about 12%, a clear gap from 31%. This detail shows that single-machine selection must be evaluated within the cycle time of the entire line; otherwise, mismatches easily occur where equipment parameters meet the standard but system capacity does not. 5. Quantifiable Results:Among the 32 sample projects, 11 have completed optimization of the mixing section; from these, three groups of quantified benefits that can be used for project initiation estimates can be summarized.
|
Jiangsu Huamu Machinery Co., Ltd. is located in Xibei Town, Wuxi City, enjoying convenient transportation and significant geographical advantages. The company specializes in the manufacturing of feed machinery and equipment, and can undertake the full-process business of scheme design, equipment ins...
No.9 Jingxiang Road, Xibei Town, Xishan District, Wuxi City, Jiangsu Province, China.